Create a Graphics Image from Pixels
2020-01-06
One simple way to draw an image by specifying the colors of pixels is to use the venerable and open Netpbm format. This is a plain text format where you specify each pixel’s color values (red, green, & blue) in order from left to right, top to bottom, and then optionally convert that resulting text file to some other format, such as png, for easy viewing.
If you don’t already have the netpbm software installed, on Debian GNU/Linux you can get it via
apt install netpbm.
For example, this foo.ppm file:
P3
# Width and height, in pixels.
10 18
# Max value for any rgb color val is 255.
255
# And now the pixel data (red, green, and blue values of 0 to 255, so,
# three numbers for each pixel). You don't have to line them up in any
# special way. Here's a red line 3 pixels thick that goes across 10 pixels.
255 0 0 255 0 0 255 0 0 255 0 0 255 0 0 255 0 0 255 0 0 255 0 0 255 0 0 255 0 0
255 0 0 255 0 0 255 0 0 255 0 0 255 0 0 255 0 0 255 0 0 255 0 0 255 0 0 255 0 0
255 0 0 255 0 0 255 0 0 255 0 0 255 0 0 255 0 0 255 0 0 255 0 0 255 0 0 255 0 0
# Now a green line,
0 255 0 0 255 0 0 255 0 0 255 0 0 255 0 0 255 0 0 255 0 0 255 0 0 255 0 0 255 0
0 255 0 0 255 0 0 255 0 0 255 0 0 255 0 0 255 0 0 255 0 0 255 0 0 255 0 0 255 0
0 255 0 0 255 0 0 255 0 0 255 0 0 255 0 0 255 0 0 255 0 0 255 0 0 255 0 0 255 0
# and blue,
0 0 255 0 0 255 0 0 255 0 0 255 0 0 255 0 0 255 0 0 255 0 0 255 0 0 255 0 0 255
0 0 255 0 0 255 0 0 255 0 0 255 0 0 255 0 0 255 0 0 255 0 0 255 0 0 255 0 0 255
0 0 255 0 0 255 0 0 255 0 0 255 0 0 255 0 0 255 0 0 255 0 0 255 0 0 255 0 0 255
# and all three once more for a total height of 18 pixels.
255 0 0 255 0 0 255 0 0 255 0 0 255 0 0 255 0 0 255 0 0 255 0 0 255 0 0 255 0 0
255 0 0 255 0 0 255 0 0 255 0 0 255 0 0 255 0 0 255 0 0 255 0 0 255 0 0 255 0 0
255 0 0 255 0 0 255 0 0 255 0 0 255 0 0 255 0 0 255 0 0 255 0 0 255 0 0 255 0 0
0 255 0 0 255 0 0 255 0 0 255 0 0 255 0 0 255 0 0 255 0 0 255 0 0 255 0 0 255 0
0 255 0 0 255 0 0 255 0 0 255 0 0 255 0 0 255 0 0 255 0 0 255 0 0 255 0 0 255 0
0 255 0 0 255 0 0 255 0 0 255 0 0 255 0 0 255 0 0 255 0 0 255 0 0 255 0 0 255 0
0 0 255 0 0 255 0 0 255 0 0 255 0 0 255 0 0 255 0 0 255 0 0 255 0 0 255 0 0 255
0 0 255 0 0 255 0 0 255 0 0 255 0 0 255 0 0 255 0 0 255 0 0 255 0 0 255 0 0 255
0 0 255 0 0 255 0 0 255 0 0 255 0 0 255 0 0 255 0 0 255 0 0 255 0 0 255 0 0 255
converted to png via
pnmtopng foo.ppm > foo.pngyields this 10×18-pixel image:

As another example, this code (written in Haxe) generates a ppm file representing a 100 × 100 image of randomly-colored pixels:
using StringTools;

class Main {
    public static function main() {
        var lines : Array<String> = [];
        lines.push("P3\n100 100\n255");
        for (i in 0...100) { // for each line
            var line = "";
            for (j in 0...100) { // for each pixel in that line
                var px =
                    ""
                    + Std.random(256) + " "
                    + Std.random(256) + " "
                    + Std.random(256) + " ";
                line += px;
            }
            line = line.rtrim();
            lines.push(line);
        }
        lines.push("");
        sys.io.File.saveContent("foo.ppm", lines.join("\n"));
    }
}
For me, this yields:

If you instead want to color particular pixels based on their position, say, relative to the center of the box, then you need some way to figure out a given pixel’s “x” and “y” coordinates from those “i-j” values in the code above.
In the following code, after calculating x & y from i & j (assume the x-axis goes to the right, and the y-axis goes up.), I also went and computed r (distance out from the center of the box) and θ (angle from the x-axis to r), and then colored the pixels taking r and θ into account.
using StringTools;

class Main {
    static var sz = 400;

    public static function main() {
        var lines : Array<String> = [];
        lines.push('P3\n${sz} ${sz}\n255');
        for (i in 0...sz) { // for each line
            var line = "";
            for (j in 0...sz) { // for each pixel in that line
                // x and y each go from -sz/2 to +sz/2.
                var x:Float =  j - sz/2;
                var y:Float = -i + sz/2;
                var r = Math.sqrt(Math.pow(x, 2)
                                + Math.pow(y, 2));
                var theta = compute_theta(x, y);

                // Red depends on r: px_r = 255/283 r
                var px_r = Math.round(0.9016 * r);
                if (px_r > 255) { px_r = 255; }
                //px_r = 0;

                // Green depends on theta: px_g =  255 / 2*Math.PI theta
                var px_g = Math.round(40.58 * theta);
                if (px_g > 255) { px_g = 255; }

                // Blue stays constant...
                var px_b = 100;

                // For testing purposes, draws a cirle.
                /*
                if (r > sz/4 && r < sz/4 + sz/40) {
                    //trace('$x\t$y\t$theta');
                    if (theta <= Math.PI/2) {
                        px_r = 255; px_g = 0; px_b = 0;
                    }
                    else if (theta > Math.PI/2 && theta <= Math.PI) {
                        px_r = 0; px_g = 255; px_b = 0;
                    }
                    else if (theta > Math.PI && theta <= 3*Math.PI/2) {
                        px_r = 0; px_g = 0; px_b = 255;
                    }
                    else {
                        px_r = 0; px_g = 0; px_b = 0;
                    }
                }
                */

                line += "" + px_r + " " + px_g + " " + px_b + " ";
            }
            line = line.rtrim();
            lines.push(line);
        }
        lines.push("");
        sys.io.File.saveContent("foo.ppm", lines.join("\n"));
    }

    public static function compute_theta(x:Float, y:Float) {
        var theta = 0.0;
        var ep = 0.001;
        if (x >= 0 && y >= 0) { // 1st quadrant
            if (x < ep) { theta = Math.PI / 2; }
            else { theta = Math.atan(y/x); }
        }
        else if (x < 0 && y >= 0) { // 2nd quad
            if (Math.abs(x) < ep) { theta = Math.PI / 2; }
            else { theta = Math.PI - Math.atan(y/-x); }
        }
        else if (x < 0 && y < 0) { // 3rd quad
            if (Math.abs(x) < ep) { theta = 3 * Math.PI / 2; }
            else { theta = Math.PI + Math.atan(-y/-x); }
        }
        else { // 4th quad
            if (Math.abs(y) < ep) { theta = 3 * Math.PI / 2; }
            else { theta = 2 * Math.PI - Math.atan(-y/x); }
        }
        return theta;
    }
}
which results in:
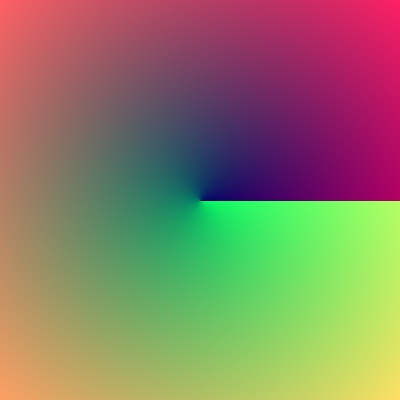
Notice how:
- the amount of red starts at zero in the center and goes to 255 as r reaches the corners
- the amount of green starts at zero at θ = 0, and goes to 255 as θ reaches 2π.